Understand Spotifarm images
Designed by farmers for farmers
NDVI, Landsat, LAI, EVI, near infra-red ... None of that here. Because you are a farmer and not an expert in satellite imagery, we designed Spotifarm to be easy to use. That's why we collect, store and analyze satellite images from the Sentinel-2 network to provide you with information that can be used by the farmer, his crop manager, his cooperative technician, his agronomist advisor, etc...
Vegetation index by crop stage of wheat
Precision agriculture finally accessible
Spotifarm offers a vegetation index that reflects the health status of yout crops.
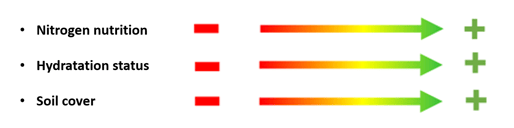
The spotifarm index is :
🔒 RELIABLE
Our vegetation index takes into account the factors that influence the images of your plots. Such as soil cover, biomass level, plant nitrogen content, plant moisture content and cloud coverage. Our algorithms also clean up disturbances such as shadows, snow or water on the plot to provide you with more images.
💚 SIMPLE
Spotifarm uses a single index to monitor crops. it works for wheat, barley, rapeseed, corn, peas, beets, potatoes and grassland. It couldn't be simpler.
🌱UNIVERSEL
Our vegetation index is constant over time. To allow you to follow the state of vegetation of your crop at any time of the year. Making it much easier to follow emergence or maturity.
Monitor your crops
A few examples to help you understand:
✅ If your wheat is less developed on an area of your plot (poor emergence, pest attack, deficiency ...) it will appear redder than the rest of the plot.
✅ If your rapeseed lacks water, the area concerned will appear redder than the rest of your plot.
✅ If your squash is highly competitive with weeds, the affected area will appear greener than the rest of the plot because there is more vegetation.
✅ When the plant cover is non-existent or too weak, the index shows no color. You can see the photo as if it was taken from the air.

Example of plot to be visited in priority during a croptour
A plot all in red therefore does not mean that everything is going badly, but simply that the crop is not yet at its maximum development. It is up to you to see if it is behind other comparable plots (variety, sowing date, etc.).
Nothing escapes you !
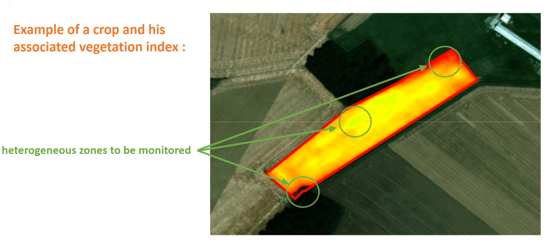
Some areas of your fields are difficult or even impossible to access depending on the crop stage (especially in corn). It is therefore important to diagnose intra-plot heterogeneity and identify areas that require special attention. You can't be everywhere ... Spotifarm can!
 Save time to monitor your crops during crop tours
These areas where the vegetation index differs from the rest of the plot are the mark of a different development of the vegetation cover (poor emergence, weed rounding, game damage...). During your tour of the plain you can focus on these areas to identify the cause of this intra-plot heterogeneity. And thanks to the geolocation on your smartphone you can guide yourself to the area in question easily.
Enjoy Spotifarm ! 🙂👍🏼